
Co-authored with Philip Mause.
This follow-up article discusses the macroeconomic forces at play in energy that have influenced our stock selection in the sector. There has been a shift for the U.S. from being a net consumer of energy to a net producer. This means opportunities for income investors like us! Part 1 of the series laid out an overview, and today’s report focuses on Natural Gas. Parts 3 and 4 of the series will cover Oil and Renewables.
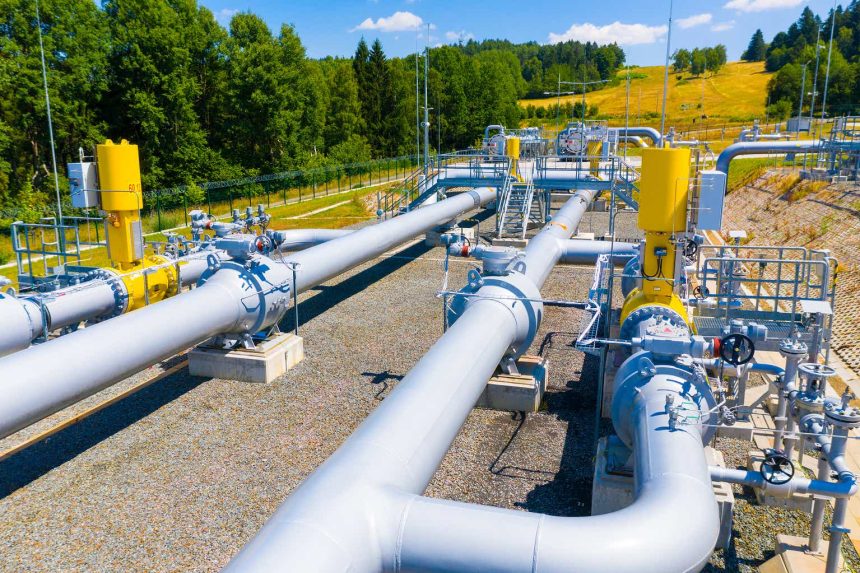
The Increase in U.S. Energy Production and Consequences for Investors – Natural Gas
Perhaps the most important element in the massive increase in U.S. energy production is the growth of natural gas production in the time period we are considering (2007-2022). In this period, the table below shows the increase in billions of cubic feet (“BCF”) of both gross withdrawals and dry gas production in 2007 and 2022. Unless otherwise noted, the source for all data is the Energy Information Agency of the US Department of Energy.
| 2007 | 2022 | |
| Gross Withdrawals | 24,664 | 43,385 |
| Dry Gas Production | 19,266 | 35,816 |
To understand the increasingly important role of natural gas, it is important to first reference some history. Before that, we want to lay out some relevant terminology. Natural Gas, not surprisingly, is a gas until it is cooled to an extremely low temperature. It is measured in cubic feet at sea level (volume increases or decreases with pressure). It is typically priced in units of thousands of cubic feet (MCF).
Conveniently, one thousand cubic feet of natural gas equals 1.036 million BTU (one author has a friend who considers this “one of the proofs of the existence of God”) and this makes certain calculations easier (for example, a trillion cubic feet is roughly equal to a quadrillion BTUs or a Quad). Natural gas is produced often containing natural gas liquids such as propane and butane and these liquids are removed at natural gas processing plants which are often operated by MLPs. After this removal, the resulting dry gas is the product most commonly used by consumers.
The Bad Old Days
First, a little bit of simplified but instructive history. Natural gas has gone through several phases in terms of how it is viewed by policymakers; these phases have been: 1) nuisance; 2) luxury; 3) necessity; and 4) national security. At first, it was a dangerous byproduct of petroleum extraction and was usually “flared.” In fact, one way in which the Texas Railroad Commission could reduce petroleum production and thereby raise prices was by using no-flare orders. Natural gas began to be used in cities, but this was largely “city gas” produced from coal.
It dawned on someone that the gas being flared could be hooked up to these networks, and pipelines started to make their way across the country. All of this was happening back in the days when things could actually be planned and built before NEPA and NIMBY restrictions. So far, so good.
Then, the Supreme Court ruled that wellhead natural gas production was subject to the jurisdiction of the Federal Power Commission, and the FPC (now named the FERC and at one time almost renamed the FUC) started to regulate the price that could be paid to natural gas producers. The “experts” at the FPC argued that there was a finite amount of natural gas in the ground and that keeping prices at a lower level would limit production. There were various estimates, most of which projected that we would have already run out of natural by now.
This policy orientation slowly began to produce a shortage, which became more severe when oil prices rose sharply in 1973. Natural gas and petroleum products were substitutes for one another as home heating fuels, fuels for power plants, and in other applications. As oil prices rose, more and more users wanted to switch to natural gas which was regulated at much lower prices. In addition, producers focused their efforts on wells showing promise of oil production rather than those showing promise of natural gas production. The situation was complicated by the fact that gas which was produced and consumed in the same state (intrastate gas) was not price regulated, leading natural gas to be more expensive but also more available in those markets.
A complex mess emerged – loved by lawyers and lobbyists, but hated by the public. Each interstate pipeline had “curtailment” proceedings in which customers would argue their comparative worthiness to receive the natural gas priced below the levels of economic demand. One point was widely agreed – natural gas could never be used “under a boiler” (i.e., to generate electricity). At one point in the interstate market, we came close to “losing towns” due to a cold January, and customers were told that it was patriotic to turn down the thermostat.
Finally, starting in the Carter administration and continuing in the Reagan and first Bush administrations, wellhead natural gas production was deregulated. First, deep gas, then “new” gas, and finally all gas. It was confidently predicted by the “experts” that in 1984-85, when “new gas” was deregulated, there would be a monstrous “fly up” in gas prices. Just the opposite occurred, and gas became plentiful.
Natural Gas and Electricity
As more and more natural gas began to be produced and as customers found that it was a reliable energy source, natural gas consumption and production increased. Now that natural gas could be used to generate electricity it gradually became a kind of “default” choice as a generating fuel. The electric industry has gone through various phases in terms of strategies for generation. In the early years, coal dominated. Then, there was a phase where it was trumpeted that nuclear power would take over and make electricity “too cheap to meter.”
For a whole series of reasons, this did not play out and after Three Mile Island and Chernobyl, it became prohibitively expensive to build new plants. At one point, residual oil started to replace coal, and in some cases natural gas (remember that we thought we were running out of natural gas) – but the 1970s oil price shock ended that. In the late 70’s, the government was encouraging “coal conversion” – which involved having utilities stop burning oil and start switching to coal.
Now, in the 90’s we began to see a halting but increasingly steady shift to natural gas. Coal was bad for global warming, oil was expensive, and nuclear was no longer on the table so natural gas was all that was left. Improvements in technology allowed for a reduction in the heat rate (the number of BTUs necessary to produce a kilowatt hour of electricity) from around 10,000 for conventional plants to 6-8 thousand for new combined cycle plants. Natural gas power plants were also much easier to site and less expensive to build than coal or nuclear plants. The table below gives total electric production and the natural gas share in 1977, 1990 (right after deregulation), 2007, and 2022 all stated in billions of kilowatt hours.
| 1975 | 1990 | 2007 | 2022 | |
| Total | 1920 | 3038 | 4157 | 4243 |
| NG | 289 | 373 | 897 | 1689 |
| NG Share | 15% | 12% | 22% | 40% |
Gas has increased its share enormously and that is the main reason that the domestic consumption of natural gas has increased. The table below provides natural gas consumption in the U.S. and net imports (the minus sign in 2022 means net exports) for those years in billions of cubic feet.
| 1975 | 1990 | 2007 | 2022 | |
| Consumption | 19,528 | 19,174 | 23,104 | 32,314 |
| Net Imports | 880 | 1,447 | 3,785 | -3,880 |
We have been fortunate to have a massive increase in domestic production just at the time when natural gas was needed by the electric power industry. More recently, that increase in production has enabled us to become the world’s largest LNG exporter and to help alleviate Europe’s problem associated with the cessation of natural gas imports from Russia. Natural gas has now reached the point where its production has become a critical national security factor.
Electrification First and the Role of Gas
The concern with global warming has led to a push for the deployment of energy sources that do not emit carbon dioxide or other greenhouse gases. These energy sources – mostly solar and wind – generate electricity but are not easily if at all deployable to directly provide transportation, heating, and other end-use services. Even if a massive amount of energy could be generated by the deployment of these technologies, there would still be carbon emissions from fossil fuel use as heating, transportation, and other end-use fuels.
As a result, climate activists have determined that a very high priority is the rapid electrification of the economy. This takes the form of mandates, prohibitions, and subsidies all favoring the replacement of gasoline-powered vehicles with electric vehicles, and the replacement of natural gas use for heating, cooking, and other purposes with electricity. This electrification, it is assumed, will make it easier to reduce carbon emissions as solar and wind electricity production expands.
At the same time, there has been strong pressure to shut down coal-fired power plants because of coal’s very high carbon dioxide emissions. In the period between 2007 and 2022, the amount of electricity produced by coal plants has plummeted.
It should be noted that there is also a general trend in developed economies for a higher and higher percentage of total energy consumption to be in the form of electricity. This trend is completely independent of efforts to combat global warming. The table below provides (solely for purposes of trend comparison) the total U.S. energy consumption in quadrillion BTUs and the total electricity production in terms of billions of kilowatt hours in 1950, 1975, 2007, and 2022.
| 1950 | 1975 | 2007 | 2022 | |
| Total Energy Consumption | 34.6 | 71.9 | 100.9 | 100.3 |
| Electricity Production | 291 | 1,747 | 3,890 | 4,048 |
Over this 72-year time frame, total energy has increased by somewhat less than a factor of 3 while electricity consumption has increased by a factor of a bit less than 14. Even in the past 15 years, electricity consumption has increased while total energy has decreased slightly.
Not surprisingly, climate activists have been somewhat more successful in their electrification strategy than they have with the actual deployment of renewable energy. The deployment of power plants and the necessary transmission facilities requires large-scale capital investment and is subject to intense and determined opposition that can stretch out the process or stop the project. While no one is going to sue me for buying an electric car, they are very likely to go to court to stop the production of the electricity necessary to power the car.
All of these factors – the retirement of coal-fired power plants, the push for electrification, and the delay in the deployment of renewable sources of power – have created a massive opportunity for natural gas to expand its use as an electricity-generating fuel. The table below shows the billions of kilowatt hours produced by coal, natural gas, nuclear, hydro, solar, and wind in the years 1990, 2000, 2007, and 2022.
| 1990 | 2000 | 2007 | 2022 | |
| Coal | 1,594 | 1,966 | 2,016 | 829 |
| Natural Gas | 373 | 601 | 897 | 1,689 |
| Hydro | 311 | 276 | 248 | 262 |
| Nuclear | 577 | 754 | 806 | 772 |
| Solar | 0.4 | 0.5 | 0.6 | 146 |
| Wind | 2.8 | 5.6 | 34.5 | 435 |
Natural gas has become the leading electricity-generating fuel by a large margin. This past July we recorded the highest demand for natural gas at power plants in history one Wednesday and then the record was broken on the very next day. An interesting thought experiment would be to imagine what things would be like without fracking. We would almost certainly have had to import massive amounts of LNG which would have been much more expensive and one of the major issues in our society would have been the outrageous increases in electric rates.
Where do we go from here?
It is always dangerous to predict the future of energy consumption and production. However, it is reasonable to assume that policy provisions as well as long-term trends will increase the consumption of electricity in the near and intermediate future. It is also reasonable to assume that there will be continued pressure to shut down coal-fired power plants and that there may be some nuclear plants getting so old that shutdown becomes necessary. Of course, there will be increased output from solar and wind, but in that connection, the 2023 data so far shows no significant increase from comparable months in 2022. Wind may be moving up a siting cost curve having used up the sites where the amount of the wind resource, ease of construction, access to grids, and a low level of NIMBY opposition made costs reasonable. To a lesser extent, the same thing may be happening to central station solar.
For this reason, one of our authors believes that distributed solar is the renewable technology that will grab the biggest share of the market going forward. Even with a massive expansion of solar and wind, the intermittent nature of these technologies will require a large and reliable base load capacity on the system and the phase-out of coal will remove many of the plants that supply such capacity. Natural gas is the only viable alternative in the near and intermediate term.
In the long term the electrification of the entire automobile and SUV fleet would consume roughly 1 trillion kilowatt hours per year or roughly 25% of current U.S. electricity production (this is based on an assumption of a 7 to 1 kilowatt hour to gallon of gasoline ratio which may be optimistic). This massive increase in electricity consumption will add to the trends described above by requiring large-scale increases in generating capacity.
Thus, viewing the U.S. energy market in isolation, it is almost impossible to imagine that there will not be an increasing demand for natural gas as a fuel for the generation of electricity. This will more than offset losses in demand due to the conversion of natural gas heating and cooking to electricity. In fact, such conversions are very likely – in the near and intermediate term – to result in increased natural gas being burned in power plants rather than in residences. The leader of the electrical supply team at the EIA (Energy Information Administration of the DOE) has said that “Almost anywhere in the United States, any incremental increase in electricity demand is met with a fossil resource.”
Exports
In the early part of this century, there was considerable activity on the Coast of the Gulf of Mexico planning and building LNG terminals getting ready for the “inevitable” need for the U.S. to import massive amounts of LNG because of the factors discussed above. As time passed the amount of gas produced through fracking surprised policymakers and began to produce a massive surplus. Plans were drastically revised, and in some cases LNG facilities were retooled so that they could operate as export facilities.
In addition, methanol production (a technology for turning natural gas into a liquid that can be mixed with gasoline; methanol is extensively used in China) started to be planned for the area. Several major plants are now in production.
The Ukraine war and measures preventing or at least dramatically reducing Russian gas sales to Europe created a powerful demand for LNG, and the U.S. was ready to jump into the breach. LNG exports have been increased and when added to the methanol production and export, now constitute a major portion of total natural gas output.
The international market – in which the U.S. is now a major player – is complex. There is a considerable amount of “stranded gas” in countries subject to boycotts and sanctions. Iran and Russia could both be massive exporters in a completely free market. There is also natural gas in Latin America which is not being produced due to political factors. Some European countries could engage in fracking if they chose to do so. So, it is possible that in the intermediate or long term, U.S. exports will face competition from new sources.
On the other hand, most developed countries (with some notable exceptions) face the same dilemmas in determining how to generate electricity that we face here in the US. Coal is available but disfavored due to carbon emissions. There is public opposition to nuclear. The intermittent nature of solar and wind requires a base load complement. As a result, there is likely to be an increasing demand for natural gas as a fuel for generating electricity in other nations.
There may be political pressure against LNG exports both by those who believe that a ban would reduce domestic prices and by those who disfavor fracking. However, our allies need the additional gas. In addition, U.S. production is likely to be cleaner than the foreign production of gas or coal which would replace it – especially as strict U.S. restrictions on the leakage of methane in the process of production and transportation are implemented.
While the export market may be more volatile than domestic demand, it is likely to be active and available to U.S. producers for a considerable time. It is ironic that, in a sense, we have done a full 180. From considering natural gas to be a finite resource on the brink of exhaustion and therefore viewing its use to generate electricity as a despicable waste, we now view it not only as our primary source for the generation of electricity but also as a source of revenue due to constantly increasing exports. This illustrates the tremendous difficulty of long and even intermediate-term energy projections. It is very easy for the “universal consensus” to be mistaken.
Investment Implications
The price of natural gas is volatile because its domestic use is weather sensitive. As a heating fuel, it benefits from a colder-than-normal winter. As an electricity-generating fuel, it generally benefits from a warmer-than-normal summer due to the importance of air conditioning demand. The best way to play this is to look for companies that earn money at least partly based on throughput or have a stable source of demand.
- Enterprise Products Partners (EPD) yield 7.4%, is the flagship for the MLP industry and has put together a solid portfolio of transportation, storage, and gas processing plants.
- Antero Resources (AR) and Antero Midstream (AM) yield 7.5%, are located in a strategic position to serve the Middle Atlantic and Northeast Region.
- Cheniere Energy (LNG) yield 1%, and Cheniere Energy Partners (CQP) yield 7.8% are the big players in the LNG export market.
In assessing other MLPs, investors can discover the percentage of revenue that is gas-related and can make a reasonable assumption that it is relatively stable. It is likely that the market has not fully digested the implications of the massive shift in the U.S. energy picture and there is still a considerable amount of money to be made.
Read the full article here