
The year 2023 has been a tough one for bond investors.
The Bloomberg Aggregate Index has posted a -1.43% return YTD through October 13th. Following losses of -1.54% in 2021 and -13.01% in 2022, the Aggregate Index is on track for its third consecutive year of negative returns. This has never happened before.
Fundamental Factors
Much of the focus has been on the Fundamental economic factors that affect the bond market.
Although the Fed’s favorite inflation measure has declined from its peak of 5.6% in Feb 2022, the Core PCE came in at a still high 3.9%, last month. Core PCE has remained above the Fed’s inflation target of 2.0% for 30 consecutive months.
This has been the primary reason why the Fed has been so aggressive with tightening monetary policy. Between March 2022 and the present, the Fed has raised the Fed Funds rate at 11 of 13 FOMC meetings for a total increase of 525 basis points (bps.) The current Fed Funds range is 5.25%-5.50%.
The possibility of another rate hike is still on the table for this year.
The Fed is concerned with the stickiness of the inflation rate and the resiliency of the economy. Many have been predicting a recession due to the Fed’s tightening, but the economy seems quite robust, as evidenced by the surprising surge in non-farm payrolls of 336,000, as released by the BLS on October 6th. This was markedly stronger than the 267,000 average gain in new jobs over the prior 12 months and the forecasted level of 170,000.
While many have been anticipating for more than a year a Fed pivot by cutting rates, with such a durable jobs market the Fed’s fear is that such a move would stimulate the interest rate sensitive parts of the economy, like housing, autos and consumer borrowing, which would then reignite inflation.
The Fed has been using the mantra of “higher for longer” with regards to their rate policy for quite some time, and only recently has it begun to sink in.
When Fed Chairman Powell says the Fed will be data dependent at future FOMC meetings, he is referring to these Fundamental economic factors.
Technical Factors
There is another dimension, however, that is also impacting the bond market, and in my view, is the major reason why US Treasury bond yields will continue to rise, and these are the Technical factors that affect bond yields.
One of the basic elements of economics is the Law of Supply and Demand, and with regard to US Treasury bonds, I will discuss how his Technical factor impacts yields.
On the Demand side for US Treasury bonds, the major buyers have been stepping away.
The largest owner of US Treasury bonds is the Federal Reserve. From 2008 through 2022, during the Fed’s fourteen-year experiment with Quantitative Easing (QE,) the Fed had a voracious appetite for Treasury bonds. Their Treasury bond holdings surged from $481 billion in 2008 to $5.9 trillion in 2022.
The Fed’s share of US Treasury Bonds owned by the public jumped from 7.6% to 25.5%.
During the pandemic, when QE was reinstituted to prevent the economy from collapsing as everything was shut down, the Fed was virtually the only buyer of government bonds. With the entire yield curve yielding less than 1% due to the Fed’s aggressive easing, the Fed bought 53% of the net new government debt issued to stimulate the economy.
But then inflation reared its ugly head, and the Fed began reversing course. In addition to raising the Fed Funds rate to 5.50%, the Fed began a policy normalization program, more commonly referred to as Quantitative Tightening (QT.) The goal of QT is to reduce the size of the Fed’s balance sheet. This was to be accomplished through allowing their Treasury bonds to roll-off at a pace of $60 billion per month. QT was announced in March 2022, and since then the Fed’s Treasury bond holdings have declined to just under $5.0 trillion, or 19.8% of publicly held Treasury debt.
The Fed is committed to continuing QT for the foreseeable future.
Treasury International Capital System and federal Reserve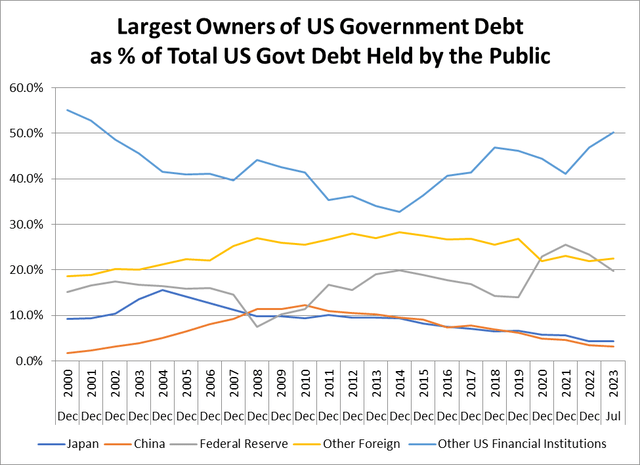
The next largest individual owners of Treasury bonds are Japan and China. At their peaks, both countries each owned well over $1 trillion Treasury bonds. China’s ownership topped out at $1.2 trillion in 2013, but has been gradually reduced to only $822 billion. Japan’s ownership reached $1.3 trillion at the end of 2021, but has since been reduced to $1.1 trillion. Their shares of ownership of Treasury bonds declined to 3.2% and 4.4%, respectively.
There are more than 40 other foreign countries that own Treasury bonds, as well, and collectively their holdings have also declined recently. From a peak of owning 28.3% of US Treasury debt in 2014 the other foreign countries holdings declined to 22.4% in 2023.
The final group of US Treasury bond holders are other US Financial Institutions. This category includes, banks, pension funds, insurance companies, mutual funds and hedge funds. As a whole, the Financial Institutions are more price sensitive than the Fed and the other foreign governments. As yields have risen, the Financial Institutions are the only ones who have increased their holdings. Their share of Treasury ownership rose from 32.8% in 2014 to 50.1% in 2023.
Then there is the Supply side of the Treasury Market.
Treasury debt is issued to help fund the US Government. The government runs a fiscal deficit each year and their expenditures, in excess of revenues, are financed by Treasury bonds. Since the Great Financial Crisis of 2008, the government’s deficits have been quite large and consequently the Treasury’s requirement for debt issuance has been massive.
For the Fiscal Year ending 9/30/23 the government recorded a deficit of -$1.7 trillion, a $300 billion increase from FYE 22’s deficit of -$1.4 trillion. This represents the fourth consecutive year of $trillion plus deficits. The projection for the current year is more of the same.
OMB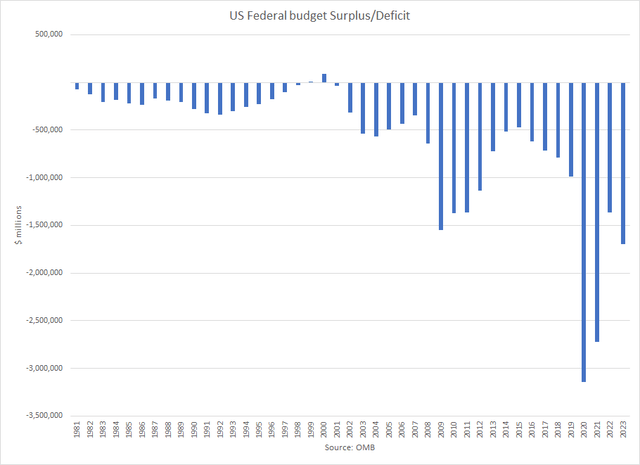
Because of the Debt Ceiling crisis this past spring, the Treasury had to resort to extraordinary measures to prevent the government from defaulting on its obligations. The Treasury had reached its statutory debt limit of $31.4 trillion in January and could no longer issue new bonds. Treasury Secretary Yellen had to move money around and delay funding some retirement programs until Congress solved the problem in June by suspending the debt ceiling until January 1, 2025.
Once Yellen received the authority to turn the debt spigots back on, the Treasury has been playing catch up with record new levels of debt. In only four months, the Treasury has issued $1.75 trillion in new bonds. This amount is larger than issuance in any full year, excluding the 2020 pandemic surge. Total government debt outstanding has grown to $33.2 trillion and counting.
US Government Debt
Trading Economics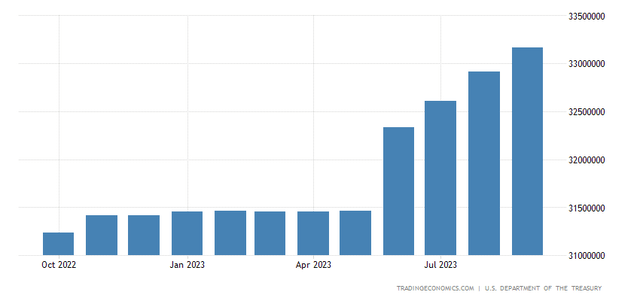
The basic economic law of Supply and Demand says that when supply increases and demand declines, prices must fall. In bond land, this means that interest rates must go up.
This has been evident in looking at the yield on the 10-year US Treasury note. The Fed began paring back their purchases of Treasuries in December 2021 as they started moving away from QE. Then in early 2022 they began cutting their Treasury holdings as they implemented QT.
When the Fed began tapering their QE purchases the 10-year Treasury note was yielding roughly 1.50%. As demand for Treasuries has declined and the supply of Treasuries has increased, the 10-year yield has climbed to 4.65%, the highest level in 16 years.
Bloomberg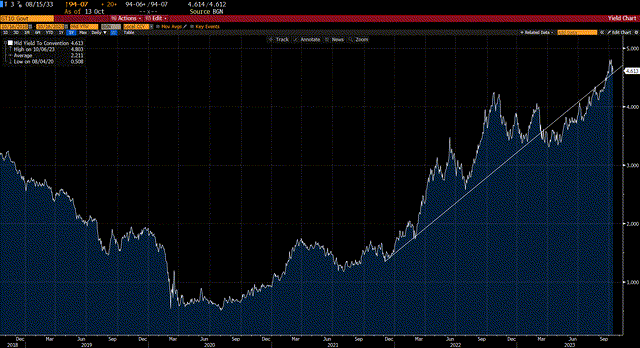
How Treasury Debt Issuance Works
Because their borrowing requirements are so immense, the Treasury has a sophisticated and robust system for fulfilling their needs under the Office of Debt Management.
The strategy is to offer a variety of debt instruments through a regular and predictable issuance mechanism. This includes promoting a broad and diverse investor base and supporting market liquidity and efficient market functioning.
To accomplish their goals, the Treasury works with a network of Primary Dealers to ensure that there will always be a market for their needs.
Currently there are 25 Primary Dealers who are authorized by the Federal Reserve System to deal directly in government bonds. These are banks or broker-dealers who must meet rigid requirements to qualify.
The first requirement is demonstrating sufficient capital. A broker dealer not affiliated with a bank must have capital exceeding $50 million. For a bank that wants to act as a Primary Dealer, they must have at least $1 billion in Tier 1 capital. They must also be registered with the SEC and the Financial Industry Regulatory Authority.
The next requirement is that the Primary Dealer must demonstrate that they maintain at least a 0.25% market share in trading government bonds. This includes showing a substantial presence as a market maker that provides two-way liquidity in US government securities.
Additionally, they must commit to bid on a consistent basis for their pro rata share at Treasury auctions. Their bids must be competitive with prevailing market levels.
Finally, they must have the proper back-office support, with membership in US clearing organizations to efficiently process transactions.
The Treasury offers several types of debt instruments. These include Treasury Bills (maturities under 1 year,), Treasury Notes (maturities 1-10 years,) Treasury Bonds (maturities greater than 10 years), Treasury Inflation Protected Securities [TIPS] and Floating Rate Notes [FRN].
There is a regular calendar, where Treasury Bills are auctioned weekly, and all of the other instruments are auctioned monthly.
The mechanism for the auctions is that the Treasury posts a schedule of type of security, the size to be issued and the date it is to be auctioned.
When an issue is announced, it then trades on a when-issued basis. When-issued trading allows market participants to buy and sell a particular security before it has been auctioned. This feature is important because it provides helpful information about the market interest in the upcoming security.
On the day of the auction the Primary Dealers gauge the interest in the security with their customers. Customers can bid on a competitive, or non-competitive basis. A non-competitive bid is usually from small investors who say they want the security and will take it at the prevailing market price. Competitive bids are for customers who say they will buy the bonds at a specific level. They then wait for the auction results to see if they are able to acquire the security at their desired level.
The Primary Dealers then convey the interest of their customers to the Treasury at the prescribed auction time.
Once the auction closes the Treasury compiles all of the bids and accepts bids, starting at the lowest yield, until they have reached sufficient demand for the amount of security they are offering. The highest yielding bid that clears the auction causes the auction to end.
The Treasury uses a single-price format, so all winners of the auction pay the same price, which is the highest yield accepted to clear the auction, even if their bid was at a lower yield.
Interpreting Auction Results
Once the auction is complete, the Treasury then reports the auction results.
The official results contain a lot of tidbits of information that are helpful in measuring the success of the auction.
The first significant piece of information is to compare the high yield to what the security was trading at on a when -issued basis immediately before the auction closed. If the high yield is below the when-issued price, this is viewed as a strong auction because it demonstrates investors were being aggressive in their bid to ensure that they will get the securities that they desire.
If the high yield is above the when -issued price, this is called a “tail,” A tail is viewed as a weak auction, because investors were bidding at a higher yield than that prevailing at auction close, and thus are indicating less interest in the security. The larger the tail, the weaker the auction.
The next piece of information to look at is the bid-to-cover ratio. This indicator measures how much demand there is for the security. The larger the bid-to-cover, the greater the interest there is in the security.
The final measure to analyze is the percentage taken down by dealers. Primary Dealers are required to submit bids to each auction. They want to provide bids for their customers, whether on a competitive, or non-competitive basis. However, if they do not have customer interest, then they must submit bids for themselves, as market-makers. Again, this is part of their role as a Primary Dealer.
However, they typically do not want to own the security themselves. A large percentage taken down by dealers usually means weak customer interest and is viewed as a bad signal, while low dealer ownership is viewed as a strong auction.
Recent Treasury Auction Results
Last week the Treasury issued 3-year Treasury Notes, 10-year Treasury Notes, and 30-Year Treasury Bonds, and the results were all viewed as sloppy.
The Treasury started with auctioning $46 billion of 3-year notes. The high yield was 4.74%, up from 4.66% last month, and the highest level since February 2007.
The high yield was above the 4.723% when-issued yield at auction, creating a 1.7 bp tail. This was the largest tail since February, and the third largest in the past ten years.
US Treasury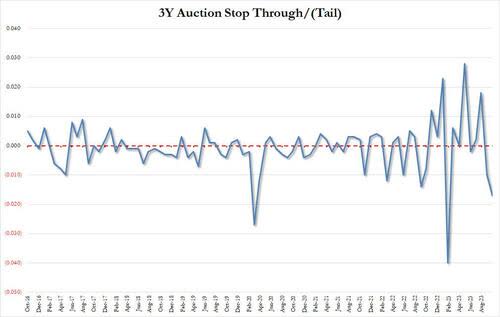
The bid-to-cover was 2.562, down from last month’s 2.75. It was the lowest cover since February, and below the six-month average of 2.792.
Bloomberg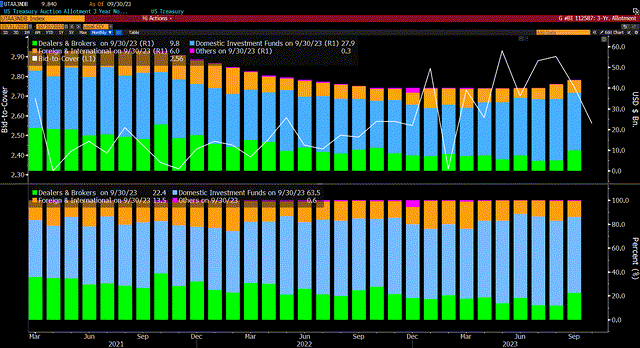
Dealers were awarded 22.1% of the total, the highest level since October 2022.
Next came the 10-year Treasury auction of $35 billion.
The high yield was 4.61%, versus 4.289% at last month’s auction. The 4.592 when-issued yield at auction created a 1.8 bp tail. This was the largest tail since the April auction, and the 8th consecutive auction with a tail.
The bid-to-cover was 2.50, down from last month’s 2.52. It was also the lowest bid-to-cover since June.
Bloomberg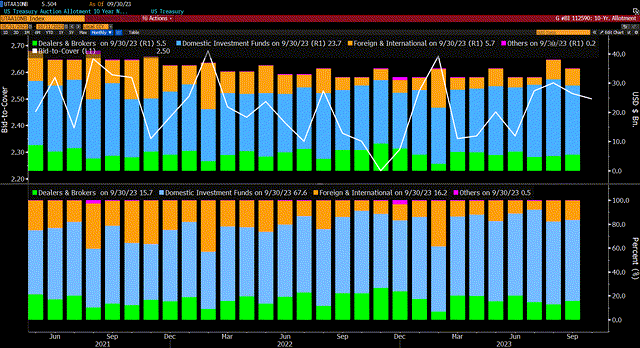
Dealers took down 20.9% of the auction, the highest level since October 2022.
The final auction of the week was the $20 billion of 30-year Treasury Bonds.
The high yield was 4.837%, up from last month’s 4.345%. This was the highest yield since August 2007.
The 30 year when-issued yield was 4.80, meaning there was a 3.7bp tail. This was the 4th consecutive 30-year auction with a tail, and it was the largest tail since November 2021. Also, it was the 3rd largest tail on record.
US Treasury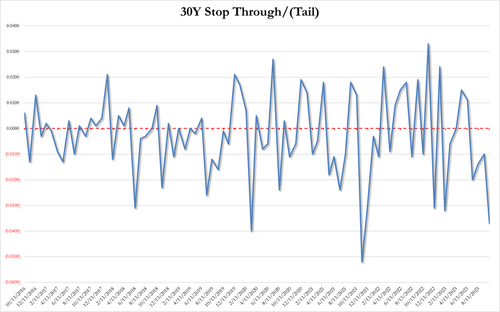
The bid-to-cover was 2.349, the lowest since February. It also was below the 6-month average of 2.44
Bloomberg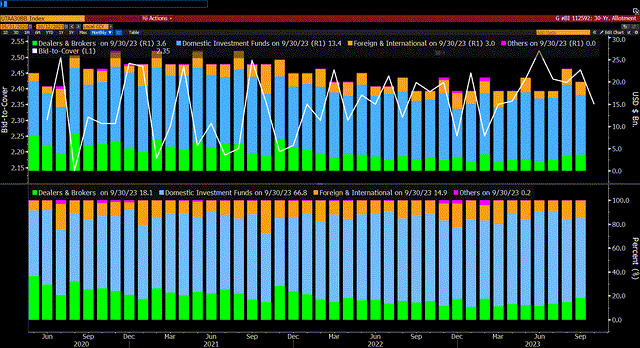
Dealers took down 18.2% of the auction, which was the largest amount since December 2021. It also was above the 6-month average dealer takedown of 11%.
Together, these auction results show the limited demand within the investor community and how the Primary Dealers were forced to own more of the auctions than they would like.
All indicators point to higher yields ahead.
Liquidity
The final Technical factor to analyze is liquidity.
The Treasury market has always been the largest and most liquid segment of the bond market. Large quantities of securities are traded daily. Size trades typically have little impact on the bid/ask spread. This is known as market depth.
Recent activity, however, has shown a troubling weakness in market depth. As measured by the Bloomberg US Government Liquidity Index, seen below, liquidity is near its all-time worst level. This index measures, on average, how far yields are away from where fair value models suggest they should be. The index has deteriorated over the past year as Treasury yields have risen, and is near the all-time high level.
Bloomberg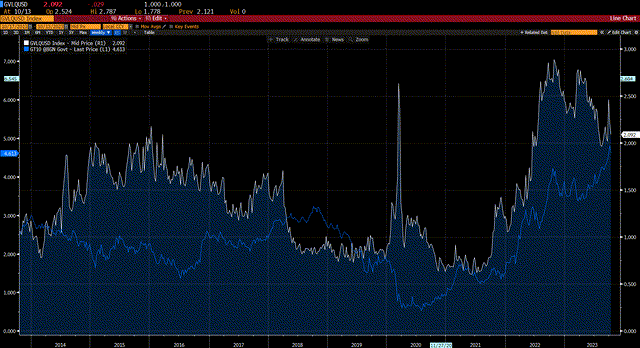
Conclusion
The Fundamentals continue to show above target inflation, and the resiliency of the economy, as measured by employment, cause the Fed to emphasize their “higher for longer” mantra.
The Technicals, as demonstrated by declining demand for Treasury debt in an environment of heavy supply due to rising budget deficits, suggest higher yields ahead.
The metrics of recent Treasury auctions support the weakness in demand among investors, and the deterioration in liquidity as rates rise suggest there is more pain to be felt investing in bonds.
For those who view the high current yields as an attractive buying opportunity, I offer the words of Rick Reider, CIO of Global Fixed Income at BlackRock:
“Buy the dip doesn’t work during QT – you just keep getting new dips.”
Read the full article here